The challenge
Easy Locker needed a second city. Choosing the wrong one means paying rent for years on a spot that travellers don't walk past.
What we did
- Joined open data for 46 cities in Python: train timetables (GTFS) for 996 stations and 1,147 line segments, passengers per station, buses and hotel stays.
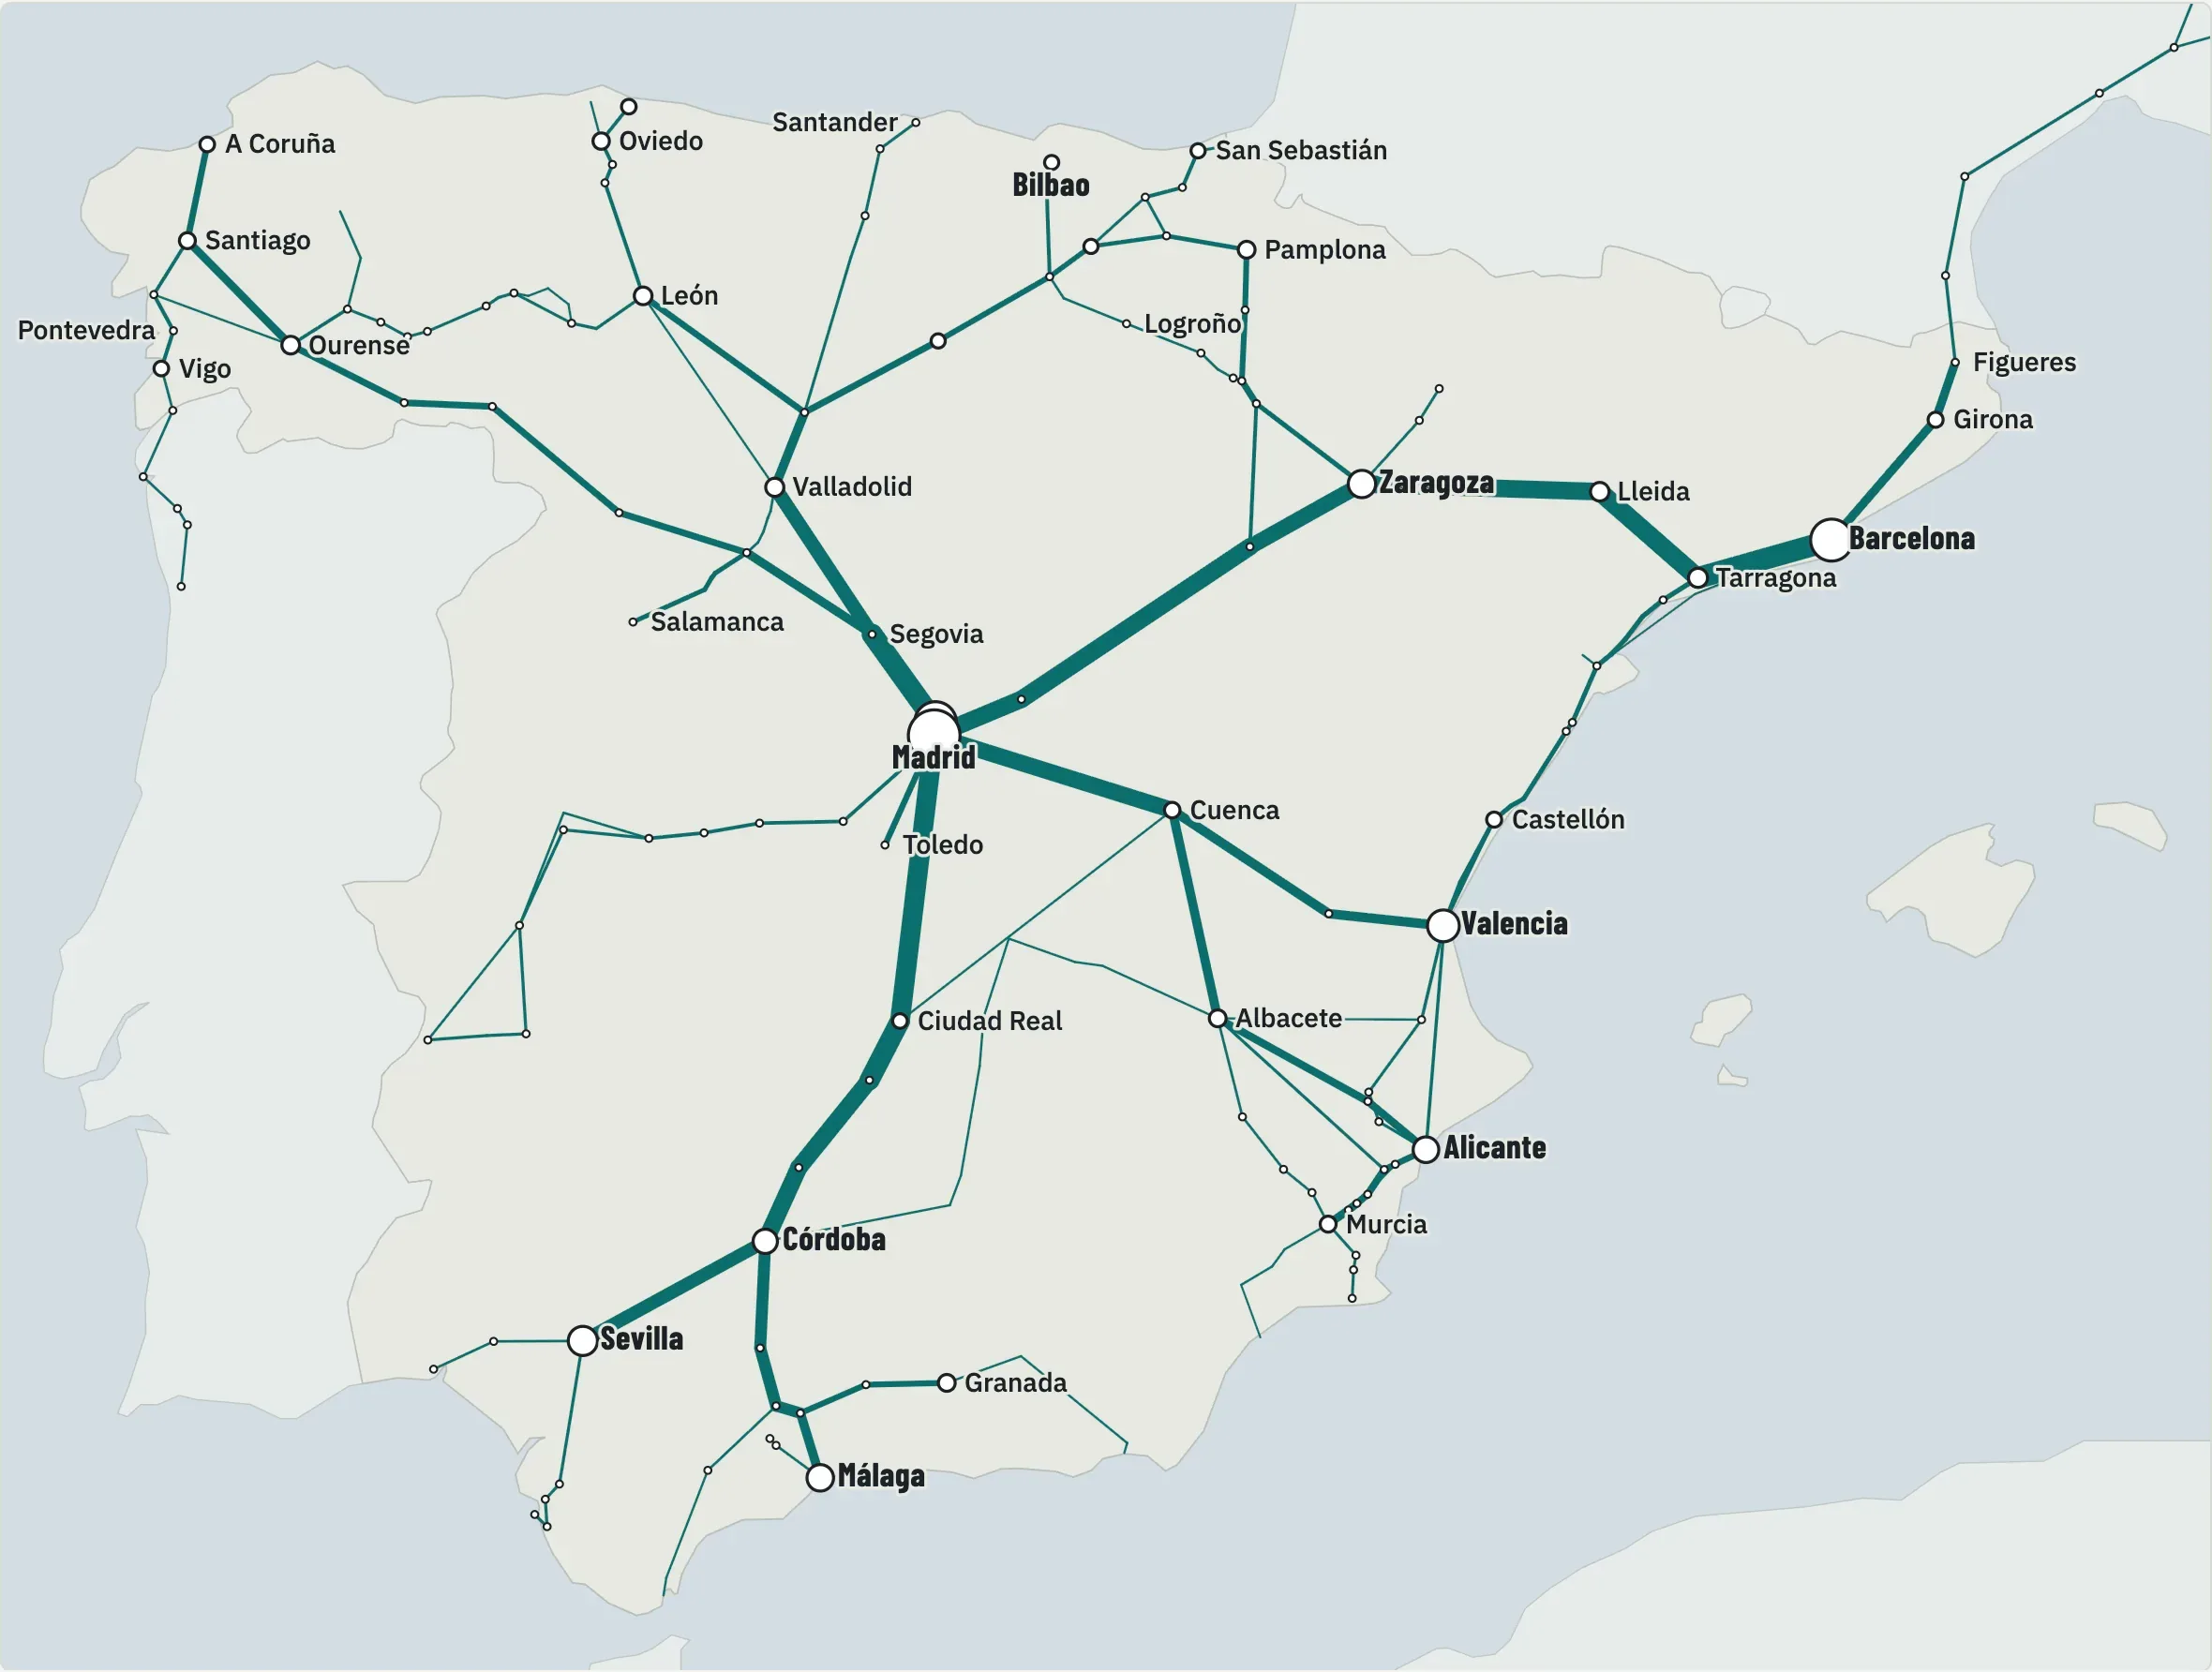
- Rebuilt Spain's rail network as a map: the thicker the line, the more trains a day.
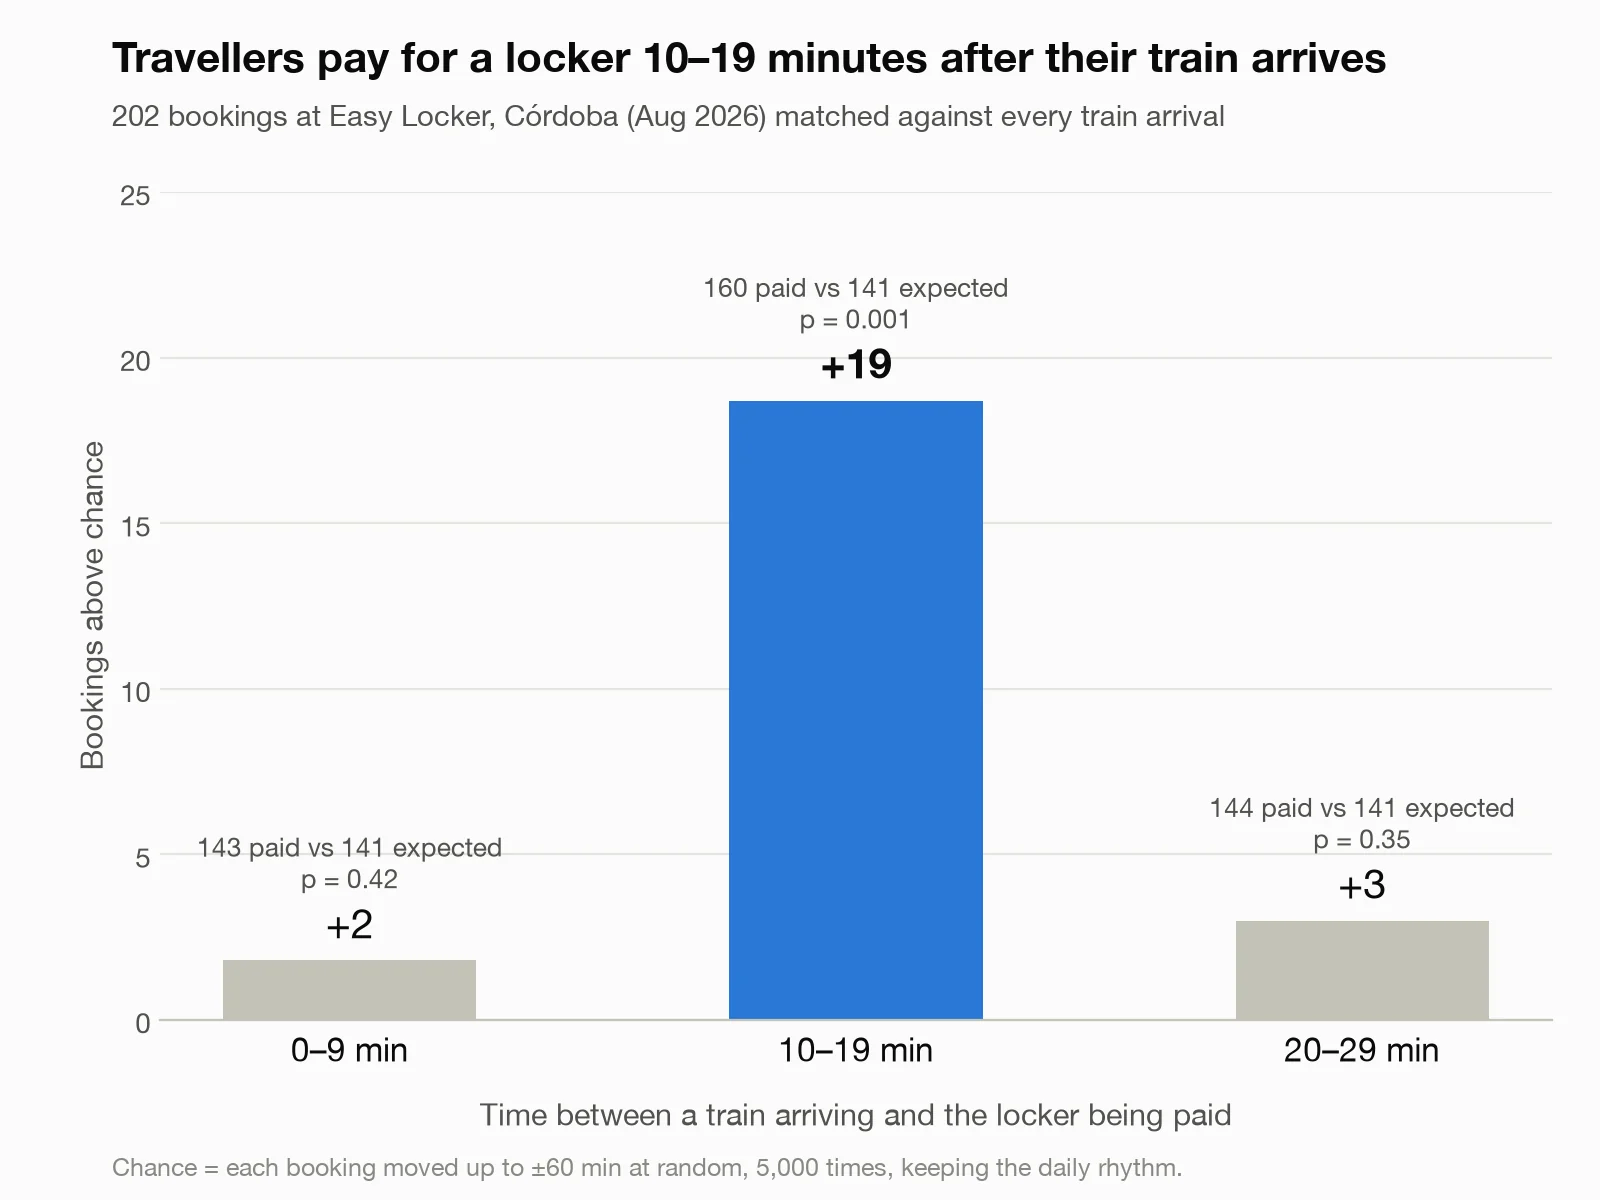
- Matched 202 August bookings with every train arrival. Travellers pay 10–19 minutes after their train gets in (p = 0.001 against 5,000 random shuffles).
- Wrote a daily script that finds premises for rent near each candidate spot, and a payback model that weighs revenue against real rents.
The result
The search narrowed from whole cities to the walk from the station, where travellers actually go. The daily search for premises keeps running.